The Great Energy Pivot: From 1960 Oil Monopoly to India’s 2030 Green AlphaIn the world of investing, history does not repeat, it rhymes. In the world of volatile markets of 2026, we are entering in
The Great Energy Pivot: From 1960 Oil Monopoly to India’s 2030 Green Alpha
In the world of investing, history does not repeat, it
rhymes. In the world of volatile markets of 2026, we are entering in ‘Green
Gold’ of the future, taking over “oil shocks” which will become the past in
this fast-changing dynamics.
The 60-year oil odyssey (1960-2026)
In 1960, When story started in Bagdad name called modern
wealth. Five nations have formed OPEC (Saudi-Arabia, Iran, Iraq, Kuwait, & Venezuela)
ended the era of seven sisters (Exxon – Standard oil of New Jersey, Mobil -
Standard oil of New York, Texaco, Gulf oil, Socal – Standard oil of California,
British Petroleum, and Shell – Royal Dutch Shell) where western oil giants dictated
prices.
Phase I
1970 Oil Shocks
First oil shocks were in 1973 pushed up the oil prices from $3
to $12 and late 1979 oil prices hit up to $40. This decades have proved that
energy was not only oil, it was a geo-political weapon, that can trigger
recessions.
Insatiable demand for oil from China has pushed up to $147
in 2008.
And now in today’s reality is that Israel-Iran war conflict
has threaten 20% of global oil supply front he Strait of Hormuz, which hits the
prices up to $120.
But thanks to modern advancement, which provided critical
buffer and this era does not exist like situation 1970, energy crisis, offering
alternative supply routes and reduced for per capita oil dependency.
Comparing India with China in current situation then India
stands in a more vulnerable position. In Asia, India is a major energy importer,
lacking China’s vast strategic oil reserves. China has leveraged with massive
stocks and high electric vehicle penetration. India vulnerability due to high fuel
inflationary pressure due to high oil prices exposure to Persian Gulf and economic
impact from surging costs, and due to India higher reliance on 85% of crude oil
imports.
Good thing is that India heavily reliant on coal for power
generation like China, which shields Indian electricity from oil prices spikes.
However, India expanding its renewable with solar and wind which currently
accounts for 20% of total electricity consumption. India has committed to
achieve 50% of total electricity power installed capacity from non-fossil by
2030, aims for 500GW.
India dependency in LPG, LNG, PNG and CNG is a critical aspect
of its energy security, due to escalation in geo-political issues and highly sensitive
Strait of Hormuz.
Key dependencies and vulnerabilities:
80% of LPG and 50% of LNG imports pass through Strait of
Hormuz.
See below table
Overview of dependencies and supply
|
Fuel Type |
Main Uses |
Import Dependency (%) |
Primary Sources |
|
LPG |
Household cooking cylinders |
58%-60% |
Saudi Arabia, UAE, Qatar, Kuwait |
|
LNG |
Industrial, fertilizer, electricity |
50% |
Qatar (approx. 47%), USA, Australia |
|
PNG |
Household & commercial piped gas |
50% |
Mix of domestic and imported LNG |
|
CNG |
Vehicular transport fuel |
50% |
Mix of domestic and imported LNG |
LNG vs PNG Resilience
LPG has more vulnerability due to higher import from Gulf
region around 90% and logistic challenges due to cylinder transport.
PNG is considered more stable due to 50% of supply comes
from domestic production and 50% imports are diversified across countries like
the USA and Russia.
Strategic Response and Future Goals:
Diversification: India is diversifying its heavily
dependency form middle east and signing long-term deals with United States (2.2
million tonnes of LPG annually) and exploring the routes which bypass the Persian
Gulf.
Infrastructure Expansion: The government aims to
expand it’s PNG network to 120 million household by 2030, which reduce
dependency from LPG cylinders.
Domestic Boost: Expansion of CBG compressed Biogas
production initiated from Krishna-Godavari (KG) Basin.
CBG used as a renewable fuel for vehicle like CNG compatible
engine, including cars, busses & trucks, it is also a alternative of CNG
& LPG. It can work as a LPG replacement for cost-effective fuels for
hotels, restaurants, hospitals and large commercial kitchens.
India also accelerating alternative fuels like Ethanol
Blends and Green Hydrogen mission.
Mission Samudra Manthan:
India’s initiatives to accelerate deep water hydro carbon
aim to shift form the current 30 wells to 100 exploratory wells, starting from
2026-2027 to reduce the 85% of import dependency.
Hydrocarbon exploration is search by geologists and geophysicists
to explore deposits of oil and natural gas trapped beneath the earth’s surface.
Phase II
Navigating the Storm (The institutional Tug of War)
Headline running with ‘Panic’, where data tells difference
story, we are witnessing classic FII’s vs DII’s showdown in the Indian markets.
The “Sell-Buy” Seesaw 40 years of Resilience
FII’s terms as opportunistic when they see opportunity or
threat, they use to sell in Indian market and either invest in other market or other
asset classes or simply sit with cash due to uncertainty. FII’s treat India as
a ATM during the global stress, meanwhile, financialization of savings (your
monthly SIP) has turned DII’s as a fire power to absorb the selling, preventing
total collapses as we seen in 90’s. Thanks to larger participation of Indian
youths for monthly SIP flow, which has given more power to DII’s and reduces
dependency on FII’s to dominate the run the Indian market.
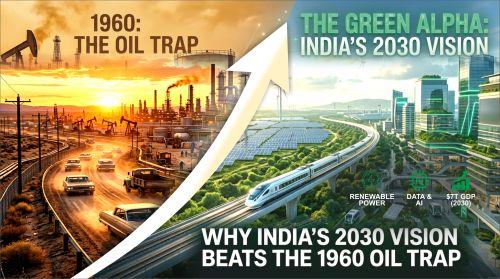
The 2030 Investment Themes- Bet for India
If oil defined last many decades, now next decades will be
defined by Electrification and Data. By 2030, India will move from oil importer
(with the saving of 1 lakh crore in imports) to renewable power house.
The Green Energy Leap (EV & BESS)
Shift to solar and wind to batteries for the grid.
The Data Centre Gold Rush
India needs 5x more Data Centre by 2030.
Why Savvy Investors Don’t Panic
Traders who losses and investors who wins in Duration and
Context.
The $5 Trillion North Star
Long term investors ignore short term oil shocks, because they
bet on long term India vision -world’s 3rd largest economy by 2028.
Structural
Resilience
In 2008 and previous major events, FII’s majorly dominate
the market and could crash the market with single handedly, but in 2026 it is
not possible, because SIP discipline provides a floor.
|
Era / Event |
Period |
Peak-to-Trough Fall |
FII Action (The \"Exit\") |
DII Action (The \"Anchor\") |
Recovery Time (to Peak) |
|
Harshad Mehta Scam |
1992–1994 |
53% |
Minimal (Pre-FII era) |
LIC & PSU Banks were the sole stabilizers. |
24 Months |
|
Dot-Com Bust |
2000–2002 |
53% |
Massive exit from Tech & \"New Economy\"
stocks. |
Shifted to \"Defensives\" (Pharma & FMCG). |
46 Months |
|
UPA-1 Election Shock |
May 2004 |
15.5% |
Panic sold on fears of halted reforms. |
Sudden massive buying to prevent systemic collapse. |
6 Months |
|
Global Financial Crisis |
2008–2009 |
61% |
Lehman collapse; FIIs treated India as an
\"Emerging Market ATM.\" |
Record-breaking buying in Blue-chips; India\'s banks
held firm. |
71 Months |
|
Yuan & Brexit Panic |
2015–2016 |
26% |
Exited due to China slowing & EU uncertainty. |
Rise of the \"Retail Force\" through first wave
of SIP discipline. |
24 Months |
|
Demonetization |
Nov 2016 |
6% |
Sudden exit from Cash-dependent sectors (Realty). |
MFs saw record inflows as cash moved into financial
assets. |
4 Months |
|
COVID-19 Panic |
March 2020 |
40% |
Fastest exit in history; \"Sell Everything\"
mode. |
The Pivot: Record SIP inflows absorbed the shock
completely. |
10 Months |
|
2024 Election Shock |
June 2024 |
6% |
Panic selling on \"Unexpected Result\"
headlines. |
Aggressive buying by MFs; retail bought the dip
instantly. |
1 Month |
|
2025-26 Geo-Politics |
Current |
13-18% |
Selling Energy-sensitive & US-Tariff exposed
sectors. |
High Conviction: Massive support for Domestic
Consumption & Green Energy. |
Ongoing |
The Wealth+ Strategy (The Solution)
How do you survive the "Blood on the Streets" of 2026 to reach the 2030 harvest?
Quantitative Filtering:
We use a 9-point “Volatility Shield” checklist (Sharpe Ratio, Alpha, and Low Drawdown, Standard Deviation, Beta Management, Sortino Ratio, Capture Ratio, Rolling Returns, Piotroski F-Score, Expense Ratio, Portfolio Overlap, Concentration) to ensure your capital is only in funds that can survive high-volatility environments.
Asset Allocation:
Don't go 100% in any one sector and asset allocation. Use Gold and Debt as "shock absorbers" during geopolitical spikes.
The Bottom Line:
The "Oil Era" is fading
into history. The "Silicon & Green Era" is the path to 2030. Are
you still using a 1960s mindset for a 2026 market?
- Educational Purpose Only: The data provided like charts and analysis is for purely educational and information purposes and should not under any circumstances be considered as professional financial advice or a recommendation for buying/selling any financial instrument.
- SEBI Registered Investment Advisor: Wealth+ Advisers(www.wealthplys.com) INA000021474
Registration granted by SEBI, membership of BASL, and certification from NISM in no way guarantee performance of the intermediary or provide any assurance of returns to investors.
- Securities market investment involves market risks. All the relevant documents should be read cautiously before investing.
- Risk of Loss: The values of investment may fluctuate both positively and negatively. Past performance does not in any way indicate future results. The level of risks is also qualitative data interpreted on the basis of historical information.
- Accuracy of Data: Though utmost care has been taken for the accuracy of the information provided, the market scenario is dynamic. The user is advised to check the facts through authentic channels, such as SEBI, RBI, or Ministry of Finance, before taking any investment decision.